 |
| A2C2 (AFMA Array Color Chart) produced by FoCal for a Nikon D800E with Nikkor 24-70/2.8G lens at 24mm f/2.8 at 1.2m distance. |

Showing posts with label lumolabs. Show all posts
Showing posts with label lumolabs. Show all posts
September 13, 2012
LumoLabs: Using FoCal for testing of an AF sensor array
July 2, 2012
The full frame mystery revisited
and the true reasons for a full frame camera
Two years ago, right before the Photokina 2010 trade show, I had a detailed look at a possible trend for full frame cameras:
At that time, full frame was a non issue and until recently, no new full frame camera was released indeed. Mirrorless system cameras (SLD) were the new kids on the block. However, I guessed that SLR camera makers, most notably Pentax, better do some serious homework in 2011 and develop a "24-35 MP full frame SLR with Exmor HD sensor". To be launched before Photokina 2012.
As it turns out, Nikon (and Canon) did exactly this: the remarkable Nikon D800 now takes the enthusiast market by storm. It was meant to be a 2011 release but it was then postponed due to the natural desasters in Japan. And what remains from the enthusiast market may well become victim of the Nikon D600 which is about to launch right before Photokina (Cologne, 2012, September 18 - 23). It is rumored to be priced right where the enthusiast market used to be a couple of years ago. OTOH, Pentax was busy to digest a change of ownership (Hoya to Ricoh) which means nothing but that they lost precious time again.
So, what does it all mean for 2012 and the years to come?
Well, before I start to share my guess work, I'd like to clarify why full frame is an interesting technical proposition at all.
The true reasons for a full frame camera
There is an amazing amount of false information floating around the internet when it comes to the benefits of form factors such as 35 mm full frame or APS-C. Typical examples include statements that full frame equals more shallow depth of field, less noise or unreasonably high sensor cost. Or that APS-C is better because it is good enough in a smaller and less expensive package. Unfortunately, such statements are too simple to be possibly true.
Full frame basically offers more choice or options which may or may not lead to better image quality or other benefits. It is necessary to look at each aspect in somewhat more detail. Therefore, I compiled a LumoLabs white paper listing the true reasons in favour of a full frame or APS-C camera:
In a nutshell and citing the paper's conclusion, full frame cameras, esp. full frame digital SLRs, are a good option to obtain premium image quality. I explained why there is a sweet spot of
image quality where full frame cameras deliver the most cost-efficient
solution today. And this is why their market impact must be increasing
rapidly.
I believe that the region where a 35 mm full frame sensor is the sweet spot may be expressed today as the region of images with between 20 and 50 clear mega pixels. At lower resolution requirements, I think APS-C still provides the better alternative
and above it may be medium format. The Nikon D800 sits right in the
middle of this region and this may explain why it is such a smash hit.
Photokina 2012 and the full frame mystery
By "full frame mystery" I describe the fact that the APS-C dSLR was originally introduced (in 1998/DCS520 $12,000) as a temporary technical compromise in order to make a digital SLR feasible at all. And 35 mm full frame was introduced when that was feasible then (in 2000/Contax-ND $6,500, and Photokina 2002/Canon-1Ds $8,000/Kodak-14n $4,000).
But for no known reason, the market separation between entry-level SLR (APS-C) and pro-level SLR (full frame) has become a non-moving barrier. Around 2008 (3 years after the 5D) it should have reached and moved out of the $1,500 enthusiast camera segment. As described in the white paper above, there are no good technical reasons to explain why it did not happen. Including the manufacturing price differences which faded away, compared to what they have been initially. Today, the manufacturing price difference shouldn't be more than a few hundred $ (own research, would be the topic of a different blog article).
I assume two reasons which are responsible for this mysterious phenomenon:
I believe we're going to see things unfold now:
While Photokina 2010 was dominated by the event of mirrorless (SLD) cameras, Photokina 2012 may start a trend for dSLRs to be full frame (only). This assumes that the entry level below $1,000 can't be defended by APS-C SLRs: the competition from SLDs (1" to APS-C) and large sensor compacts (1" etc.) may become too intense and the accuracy problems of APS-C phase-AF beyond 20 MP may start to become a problem.
On the other hand, I don't expect SLRs to disappear any time soon. A good optical viewfinder is almost impossible to beat in the next couple of years and hybrid viewfinders may bring some of the benefits of SLDs to SLRs.
Therefore, I speculate that four things are going to happen until Photokina 2014:
And Pentax ? ... ;)
Long time followers of my blog know that I have quite some sympathy for Pentax. Pentax, 10x smaller than Nikon or Canon but with products challenging the most popular cameras of the big two. E.g., I consider the Pentax K-5 to be a better camera than the Nikon D7000: similiar, but more beautiful, more ergonomic and more fun to use. This is why I would be very disappointed to see Pentax and their K mount continue to fade away as it did in the past since the arrival of the K10D.
Pentax, now having lost half of their enthusiast user base, cannot wait until Photokina 2014 to join what then will be the full frame SLR bandwagon. Their remaining enthusiast users can't wait: the jump in image quality from, say a K-5 to say, a D800 is too dramatic to be ignored. I cannot imagine that Ricoh has bold plans for the K mount but then doesn't come to the same conclusion. Therefore, I assume Pentax to at least "leak" information around Photokina 2012 wrt their own plans. Speculation goes they release a full frame SLR with the Sony A99 sensor in 2013. They better do. The K mount has no future as APS-C only. Esp. as the mirrorless K mount bodies (K-0x) make much more sense with full frame.
CU @ PK12 :)
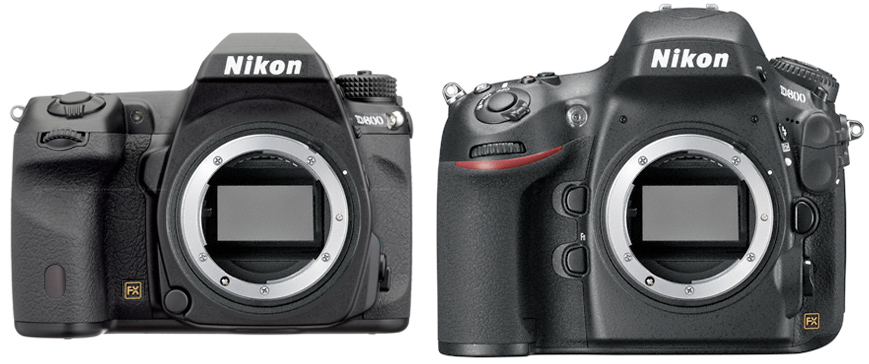 |
| Nikon D800 (right) and a hypothetical more compact D800c full frame camera (left) built along the design principles of the beautiful Pentax K-5 APS-C SLR. The K-5 is smaller than the D800c depicted above. -- please click to enlarge -- |
At that time, full frame was a non issue and until recently, no new full frame camera was released indeed. Mirrorless system cameras (SLD) were the new kids on the block. However, I guessed that SLR camera makers, most notably Pentax, better do some serious homework in 2011 and develop a "24-35 MP full frame SLR with Exmor HD sensor". To be launched before Photokina 2012.
As it turns out, Nikon (and Canon) did exactly this: the remarkable Nikon D800 now takes the enthusiast market by storm. It was meant to be a 2011 release but it was then postponed due to the natural desasters in Japan. And what remains from the enthusiast market may well become victim of the Nikon D600 which is about to launch right before Photokina (Cologne, 2012, September 18 - 23). It is rumored to be priced right where the enthusiast market used to be a couple of years ago. OTOH, Pentax was busy to digest a change of ownership (Hoya to Ricoh) which means nothing but that they lost precious time again.
So, what does it all mean for 2012 and the years to come?
Well, before I start to share my guess work, I'd like to clarify why full frame is an interesting technical proposition at all.
The true reasons for a full frame camera
There is an amazing amount of false information floating around the internet when it comes to the benefits of form factors such as 35 mm full frame or APS-C. Typical examples include statements that full frame equals more shallow depth of field, less noise or unreasonably high sensor cost. Or that APS-C is better because it is good enough in a smaller and less expensive package. Unfortunately, such statements are too simple to be possibly true.
Full frame basically offers more choice or options which may or may not lead to better image quality or other benefits. It is necessary to look at each aspect in somewhat more detail. Therefore, I compiled a LumoLabs white paper listing the true reasons in favour of a full frame or APS-C camera:
- www.falklumo.com/lumolabs/articles/equivalence/ff.html
- The true reasons for a full frame camera (the above as PDF)
- LumoLabs: Camera equivalence (white paper laying the foundation, to be read first)
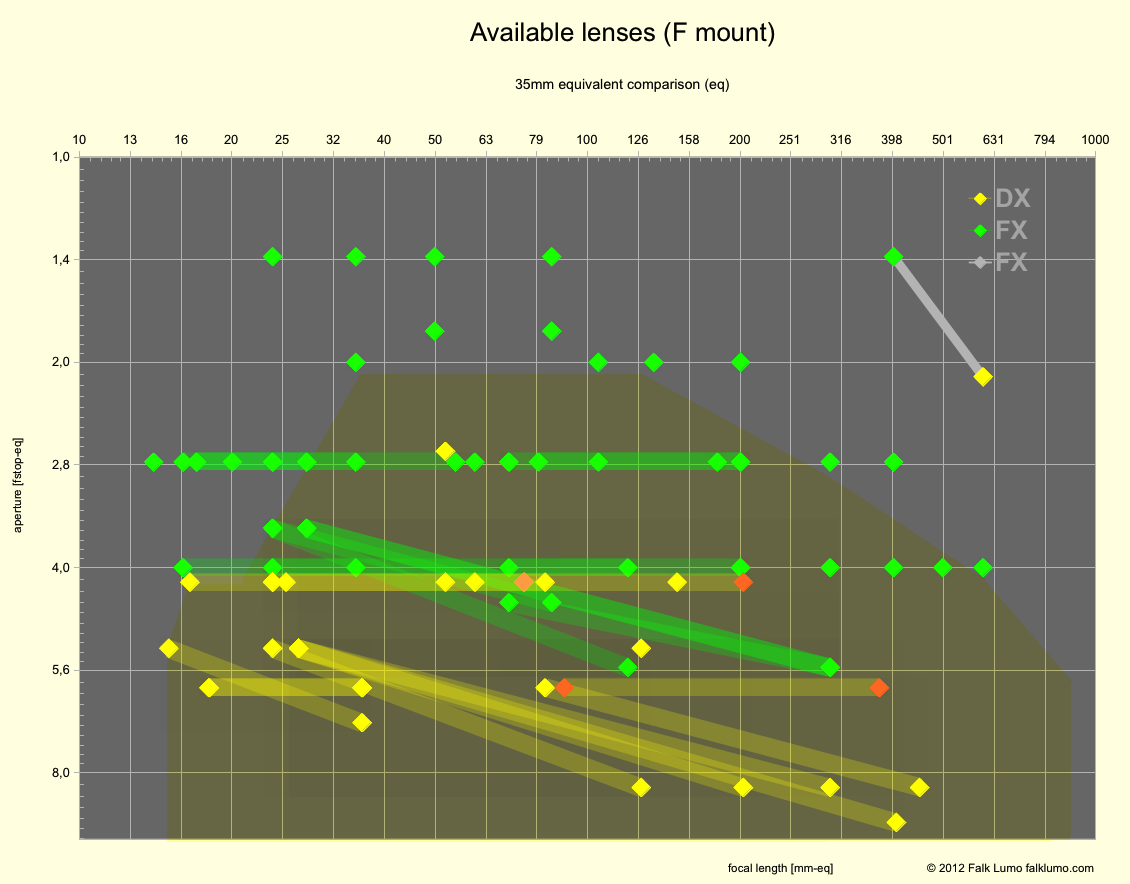 |
| Available interchangeable lens options (in 35-mm equivalent terms) for cameras with 35-mm or APS-C sensor, resp. Shown with an emphasis on Nikon. Fig. from the white paper "The true reasons for a full frame camera". -- please click to enlarge -- |
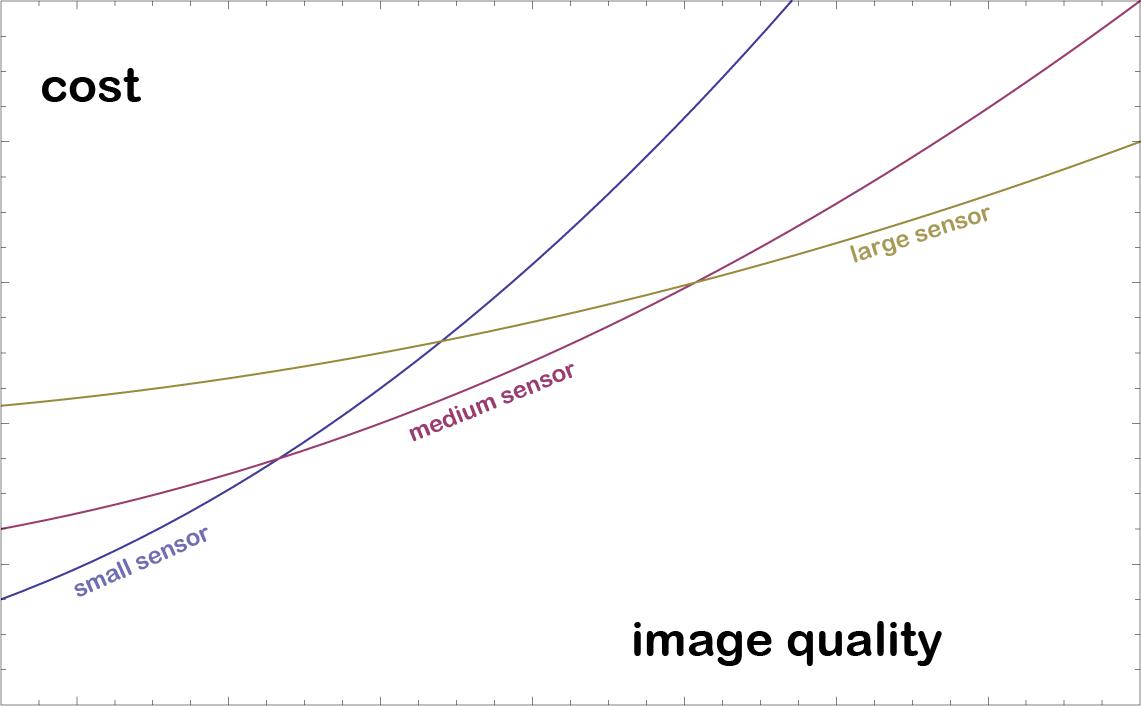 |
| Cost vs. performance for various sensor formats. Fig. from the white paper "The true reasons for a full frame
camera". -- please click to enlarge -- |
Moreover, I think that the region of
premium image quality will remain the domain of SLRs for quite a while.
Because lenses aren't that small anyway and the optical viewfinders are
harder to beat (they are hard to beat anyway when it comes to low light
and fast action). This means that every SLR maker will ultimately have
to offer a compelling range of full frame cameras and lenses (in order
to stay SLR maker).
Statements derived from the above white paper I am going to use here include:
- There is a level of maximum image quality where full frame offers no benefit over APS-C. At that level, images from full frame and APS-C cameras are basically indistinguishable. And at that level, the weight and price difference between both types of cameras is small (technically speaking).
- There is a level of image quality which corresponds to printout sizes of approx. DIN A2 or 16" x 24" where full frame cameras (today) offer the better price/performance ratio (technically speaking) or the only option (practically speaking).
- There are some niche applications (single image HDR, very low available light, fast and accurate focus, portrait/very shallow depth of field) where full frame cameras are clearly better.
- There are (fewer) niche applications (sports) where an APS-C or a low pixel count (or a fast crop mode) full frame camera still is a better choice.
I confine my consideration to APS-C vs. full frame. The reason is simple: other formats don't share the same mount. And larger or smaller formats currently slightly lack in terms of implementation. E.g., you may look at the current score board leaders at dxomark.com , using tscore = dxoscore + 30 x log_2(crop-factor) as format-independend technology index (the DxO score increases by 15 per EV stop of performance):
- Medium format (Phase One IQ180, Pentax 645D): tscore = 72
- Full Frame (Nikon D800E): tscore = 96
- APS-C (Pentax K-5): tscore = 100
- FourThirds (Panasonic Lumix DMC GH2): tscore = 90
Photokina 2012 and the full frame mystery
By "full frame mystery" I describe the fact that the APS-C dSLR was originally introduced (in 1998/DCS520 $12,000) as a temporary technical compromise in order to make a digital SLR feasible at all. And 35 mm full frame was introduced when that was feasible then (in 2000/Contax-ND $6,500, and Photokina 2002/Canon-1Ds $8,000/Kodak-14n $4,000).
But for no known reason, the market separation between entry-level SLR (APS-C) and pro-level SLR (full frame) has become a non-moving barrier. Around 2008 (3 years after the 5D) it should have reached and moved out of the $1,500 enthusiast camera segment. As described in the white paper above, there are no good technical reasons to explain why it did not happen. Including the manufacturing price differences which faded away, compared to what they have been initially. Today, the manufacturing price difference shouldn't be more than a few hundred $ (own research, would be the topic of a different blog article).
I assume two reasons which are responsible for this mysterious phenomenon:
- Market separation: Spreading information (sometimes misleading, esp. from Canon), how expensive it would be to make a full frame sensor, vendors have been able to sell cheap APS-C cameras w/o cannibalizing their revenue from expensive pro gear. Customers trusting such statements never "asked" for more, or accepted a premium price for full frame.
- The differences between APS-C and full frame (other than missing equivalent lens options) may not have been significant between about 10 and 20 MP. Therefore, the "good enough" argument applies to some extent.
I believe we're going to see things unfold now:
While Photokina 2010 was dominated by the event of mirrorless (SLD) cameras, Photokina 2012 may start a trend for dSLRs to be full frame (only). This assumes that the entry level below $1,000 can't be defended by APS-C SLRs: the competition from SLDs (1" to APS-C) and large sensor compacts (1" etc.) may become too intense and the accuracy problems of APS-C phase-AF beyond 20 MP may start to become a problem.
On the other hand, I don't expect SLRs to disappear any time soon. A good optical viewfinder is almost impossible to beat in the next couple of years and hybrid viewfinders may bring some of the benefits of SLDs to SLRs.
Therefore, I speculate that four things are going to happen until Photokina 2014:
- Full frame SLRs become mainstream above $1,000, in a more compact form factor.
- Hybrid viewfinders combine the best of two worlds in high end SLRs.
- Mirrorless SLDs and large sensor compact cameras dominate the segment between $500 and $1,000, mobile phones below.
- Full frame SLDs emerge.
And Pentax ? ... ;)
Long time followers of my blog know that I have quite some sympathy for Pentax. Pentax, 10x smaller than Nikon or Canon but with products challenging the most popular cameras of the big two. E.g., I consider the Pentax K-5 to be a better camera than the Nikon D7000: similiar, but more beautiful, more ergonomic and more fun to use. This is why I would be very disappointed to see Pentax and their K mount continue to fade away as it did in the past since the arrival of the K10D.
Pentax, now having lost half of their enthusiast user base, cannot wait until Photokina 2014 to join what then will be the full frame SLR bandwagon. Their remaining enthusiast users can't wait: the jump in image quality from, say a K-5 to say, a D800 is too dramatic to be ignored. I cannot imagine that Ricoh has bold plans for the K mount but then doesn't come to the same conclusion. Therefore, I assume Pentax to at least "leak" information around Photokina 2012 wrt their own plans. Speculation goes they release a full frame SLR with the Sony A99 sensor in 2013. They better do. The K mount has no future as APS-C only. Esp. as the mirrorless K mount bodies (K-0x) make much more sense with full frame.
CU @ PK12 :)
April 7, 2012
LumoLabs: Nikon D800 video function demystified
 |
| Nikon D800 FX mode 1080p video frame (click for original size) |
One point of interest has been how either camera actually creates its video frames. I now had a chance to apply LumoLabs' testing methology to a loaner D800 camera and figure it out for 1080p video in FX mode. I am having a look at live view performance too.
You may jump to the conclusion at the end if you just want to read what we found, igoring how we did it :)
Nikon D800 FX mode FullHD 1080p video
The title image shows one frame from a 1080p video taken with the Nikon D800 (in FX mode, it supports a number of crop video modes too). It shows a zone plate test chart which can be used to perform a sampling error frequency analysis.
Please, read falklumo.blogspot.de/2009/10/lumolab-welcome-and-testing-methodology.html to learn more about the testing methodology incl. access to the original of the test chart allowing everybody to replicate my analysis.
There is a bit of (gray colored) moiré from the printing process. This is because scaling and printing of zone plates is a non-trivial art in itself ;) You can actually measure the printer's native resolution by inspecting the printed zone plate chart. Below, you find a photograph of the print (in 14.6 MP resolution) allowing you to determine what moiré patterns are from the printing process actually.
 |
| Printed zone plate chart (still shot with a 14.6 MP camera, for reference) |
However, all colorful moiré patterns are artefacts introduced by the D800 video system. It allows us to precisely measure how it works. Let's have a close look at the one of the two center discs:
 |
| Analyzed region of interest in the D800 video frame |
The big discs are constructed such that the 1080p Nyquist frequency emerges at its outer circle. The two center discs have their edge at twice this Nyquist frequency and the four tiny discs at four times this frequency. Therefore, the false color moiré disc emerges at (149px/258px x2) or 1.155x the 1080p Nyquist frequency (1247 px). This means that the Nikon D800 samples ~1247 horizontal lines from its sensor.
Now, let's make a back-of-the envelope calculation:
An FX frame in video mode is taken from a 6720 x 3780 px region (which actually is a 1.095x crop from the full 7360 x 4912 px frame (this information is from the Nikon user guide, translating physical dimensions into pixels). Because 3780 / 1247 = 3.03 and because 1% is our measurement error, we have proof that the Nikon D800 samples every third horizontal line from its sensor.
A second result is that the ever so slightly color moiré for horizontal frequencies disappears at the Nyquist frequency. The D800's AA filter is effective here, the remaining moiré is from the printing. The D800E would have a bit of additional color moiré here, but by far not as strong as in the vertical direction. So, I believe that the Nikon D800 samples every vertical row from its sensor.
Below is what I believe how Nikon implemented line skipping:
 |
| Likely D800 sensel sampling matrix |
and here is a slightly more symmetrical scheme which I cannot entirely exclude although I think it isn't used in this mode:
 |
| Unlikely sensel sampling matrix |
This is similiar to what the Canon 5DmkII did actually. However, there is one important aspect where the D800 is different:
A native 1080p video frame is 6720 x 1260 px, demosaiced to a 2240 x 1260 px RGB frame.
And the final 1080p video frame is further downsampled 7:6 to 1960 x 1080 px which gives the D800 a slight edge in resolution and edge flicker behaviour over a 5DmkII.
High ISO noise in video
What we found has one important consequence: High ISO noise in video! Because of the FX video crop and skipping two thirds of sensels, the ISO performance in video is shifted by a factor 3.60. E.g., At ISO 12,800, the noise looks (as bad) as at ISO 46,000 from a camera using all available sensors for video (except for the 16:9 ratio crop of course).
You may note however, that the D800 still samples 6720 x 1260 sensels for a 1920 x 1080 frame or 4.08 sensels per pixel. For this reason, at ISO 12,800, the noise looks (as good) as at ISO 3,200 from a still image when pixel peeping at a 100% (1:1) level. So, pixel noise in D800 video is 2 stops less compared to still while it could have been 3.85 stops less when reading out a maximum of sensels. If you consider this bad or good is up to you.
Below, I have extracted frames from the ISO comparison performed by crisislab.com:
 |
| Video noise comparison D800 vs. 5DmkIII -- original frames (c) 2012 crisislab.com |
From that, I can already conclude that the 5DmkIII reads out all its sensels, i.e., does no line skipping. However, I didn't run a resolution analysis for the 5DmkIII. However, hearing about resolution complaints for 5DmkIII video, I think they bin pixels before read out. This improves noise and aliasing performance but unlike downsampling, doesn't help the resolution.
Nikon D800 Live View implementation notes
I have applied our testing methodology to Nikon's live view implementation too.
 |
| D800 live view, photograph of the rear LCD (no zoom level) |
If we zoom in, we get a result as follows.
 |
| D800 live view, photograph of the rear LCD (high zoom level) |
In live view, the D800 switches from third line to second line skipping when zooming in!
Lessons for manual focusing: (1) zoom in and (2) focus onto vertical structures which have twice the resolution in live view! Focus on trees, edges of buildings rather than horizon or roof top.
Conclusion
The D800 creates FX 1080p video in the following way:
- Crop a region of 6720 x 3780 sensels (crop factor 1.095).
- Read only every third line out of this region, but all sensels in a line. The result is an 6720 x 1260 sensel RGGB Bayer pattern which can be demosaiced.
- The resulting 2240 x 1260 RGB image is downsampled 7:6 to the final 1920 x 1080 px resolution.
- Compared to an optimum architecture, only 1/3.6 of sensels are read which makes the D800 loose up to 1.8 stops in high ISO video performance.
- When zooming into a live view image, the D800 switches line skipping from 3x to 2x.
- Manual forcus should use zoomed live view focusing vertical edges.
On the other hand, there will be no more excuses for line skipping in the future. Not after Nokia got rid of it in their 41 MP 808 mobile phone ...
Enjoy your read :)
Falk
February 21, 2012
LumoLabs: Camera equivalence
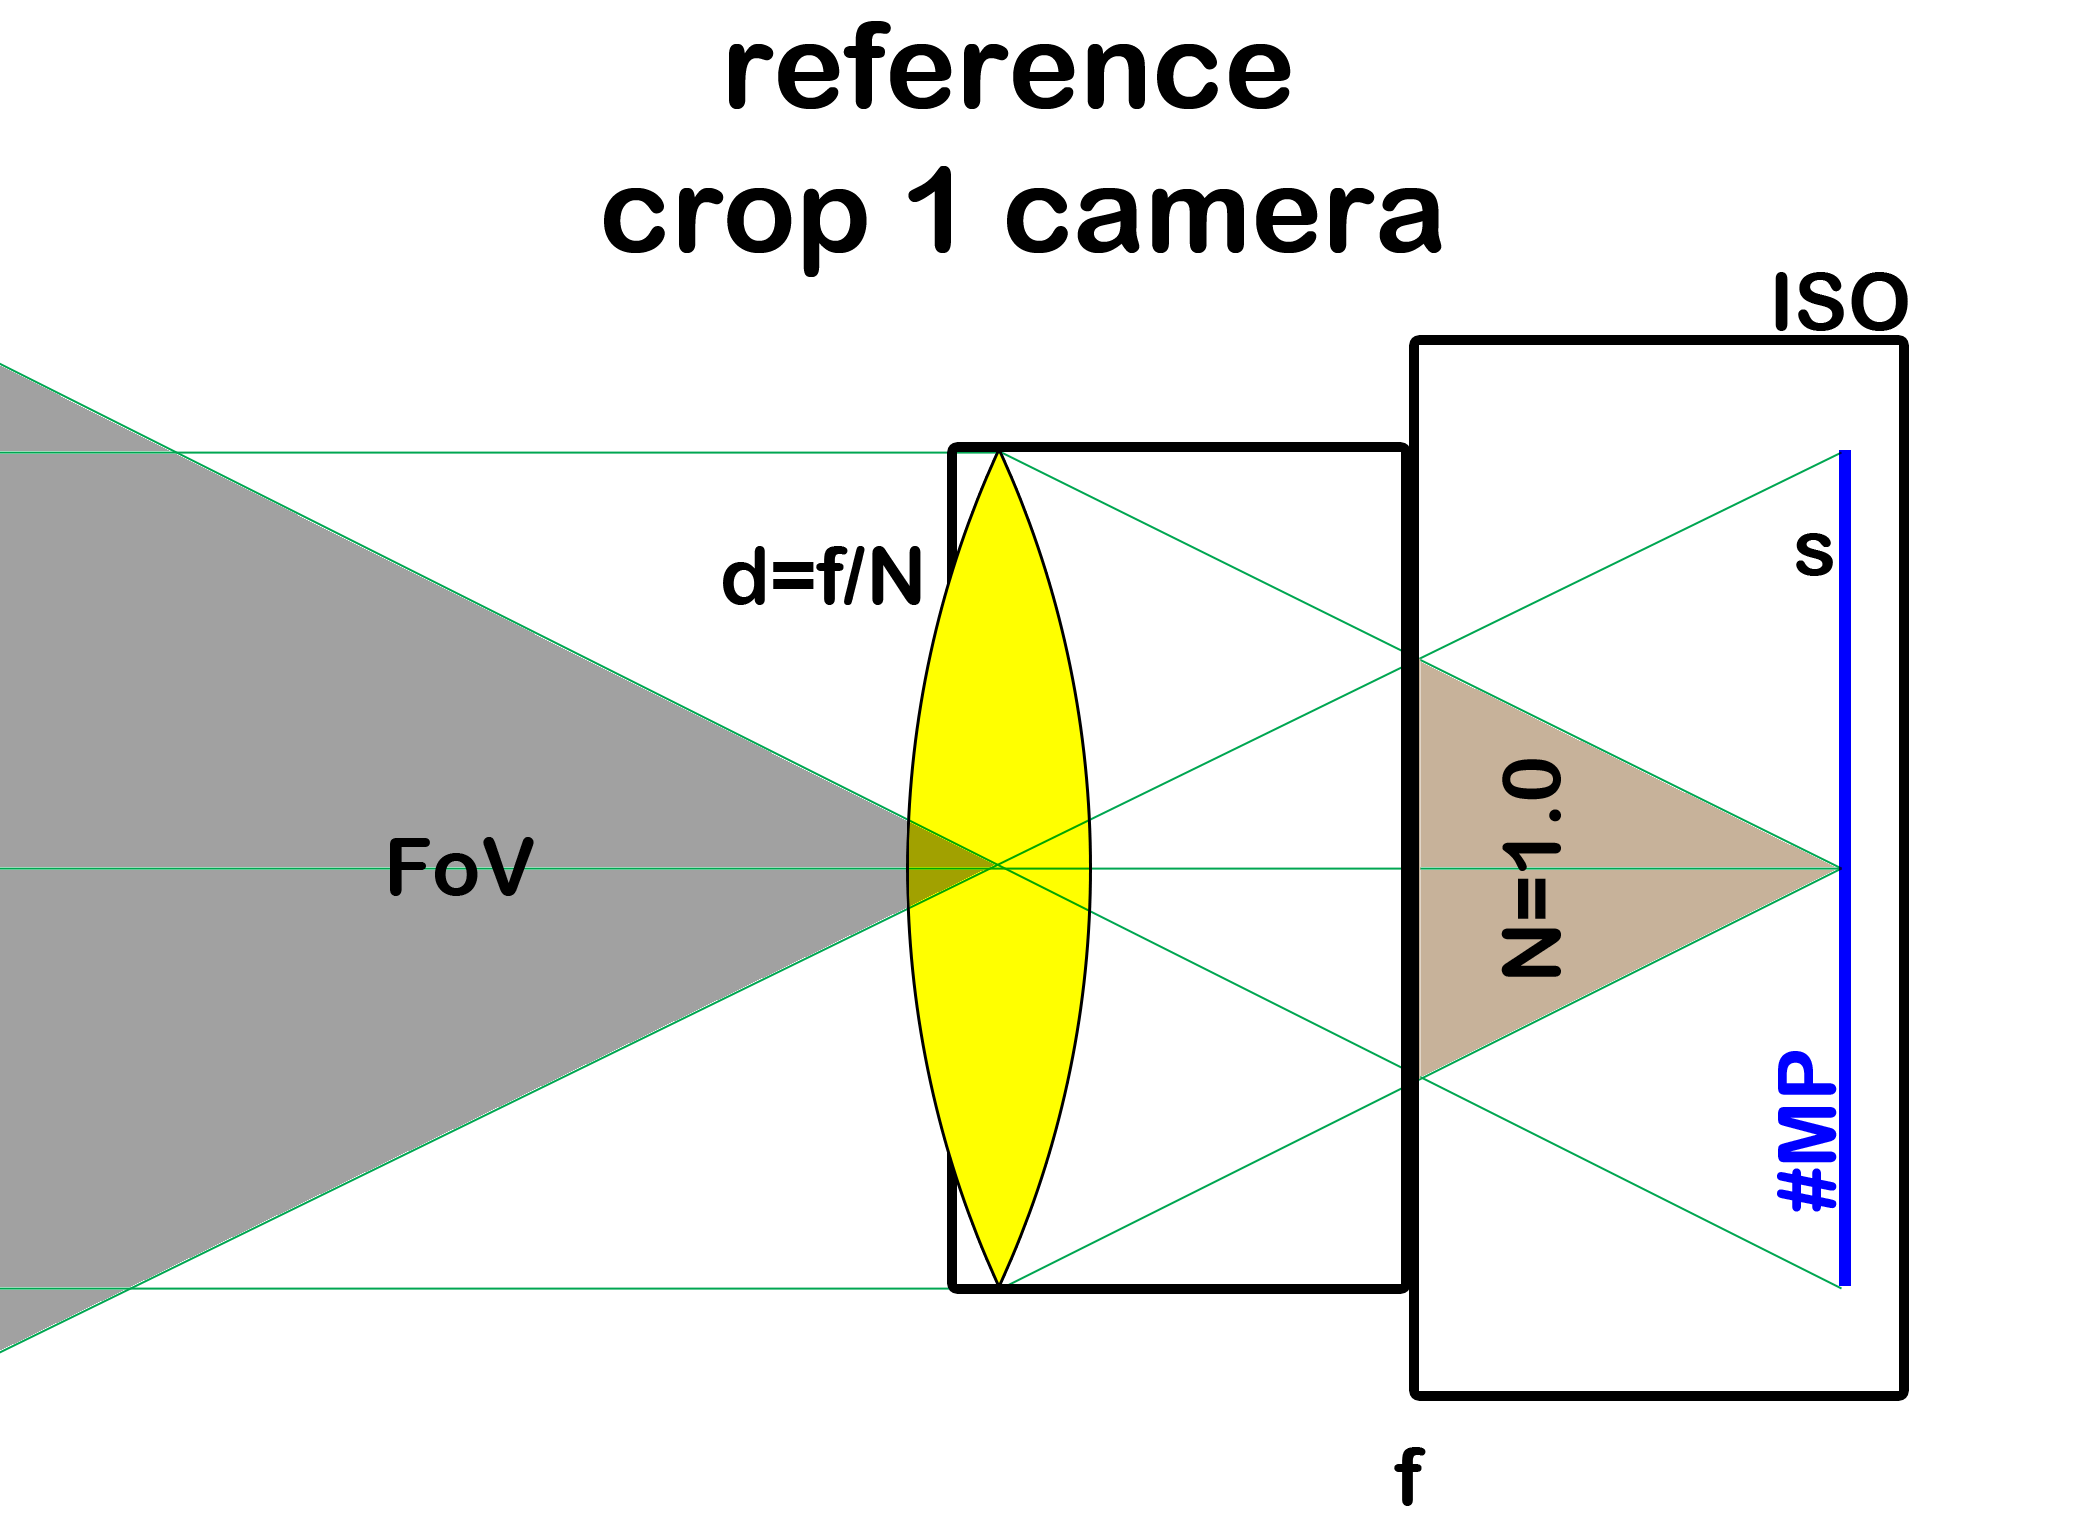
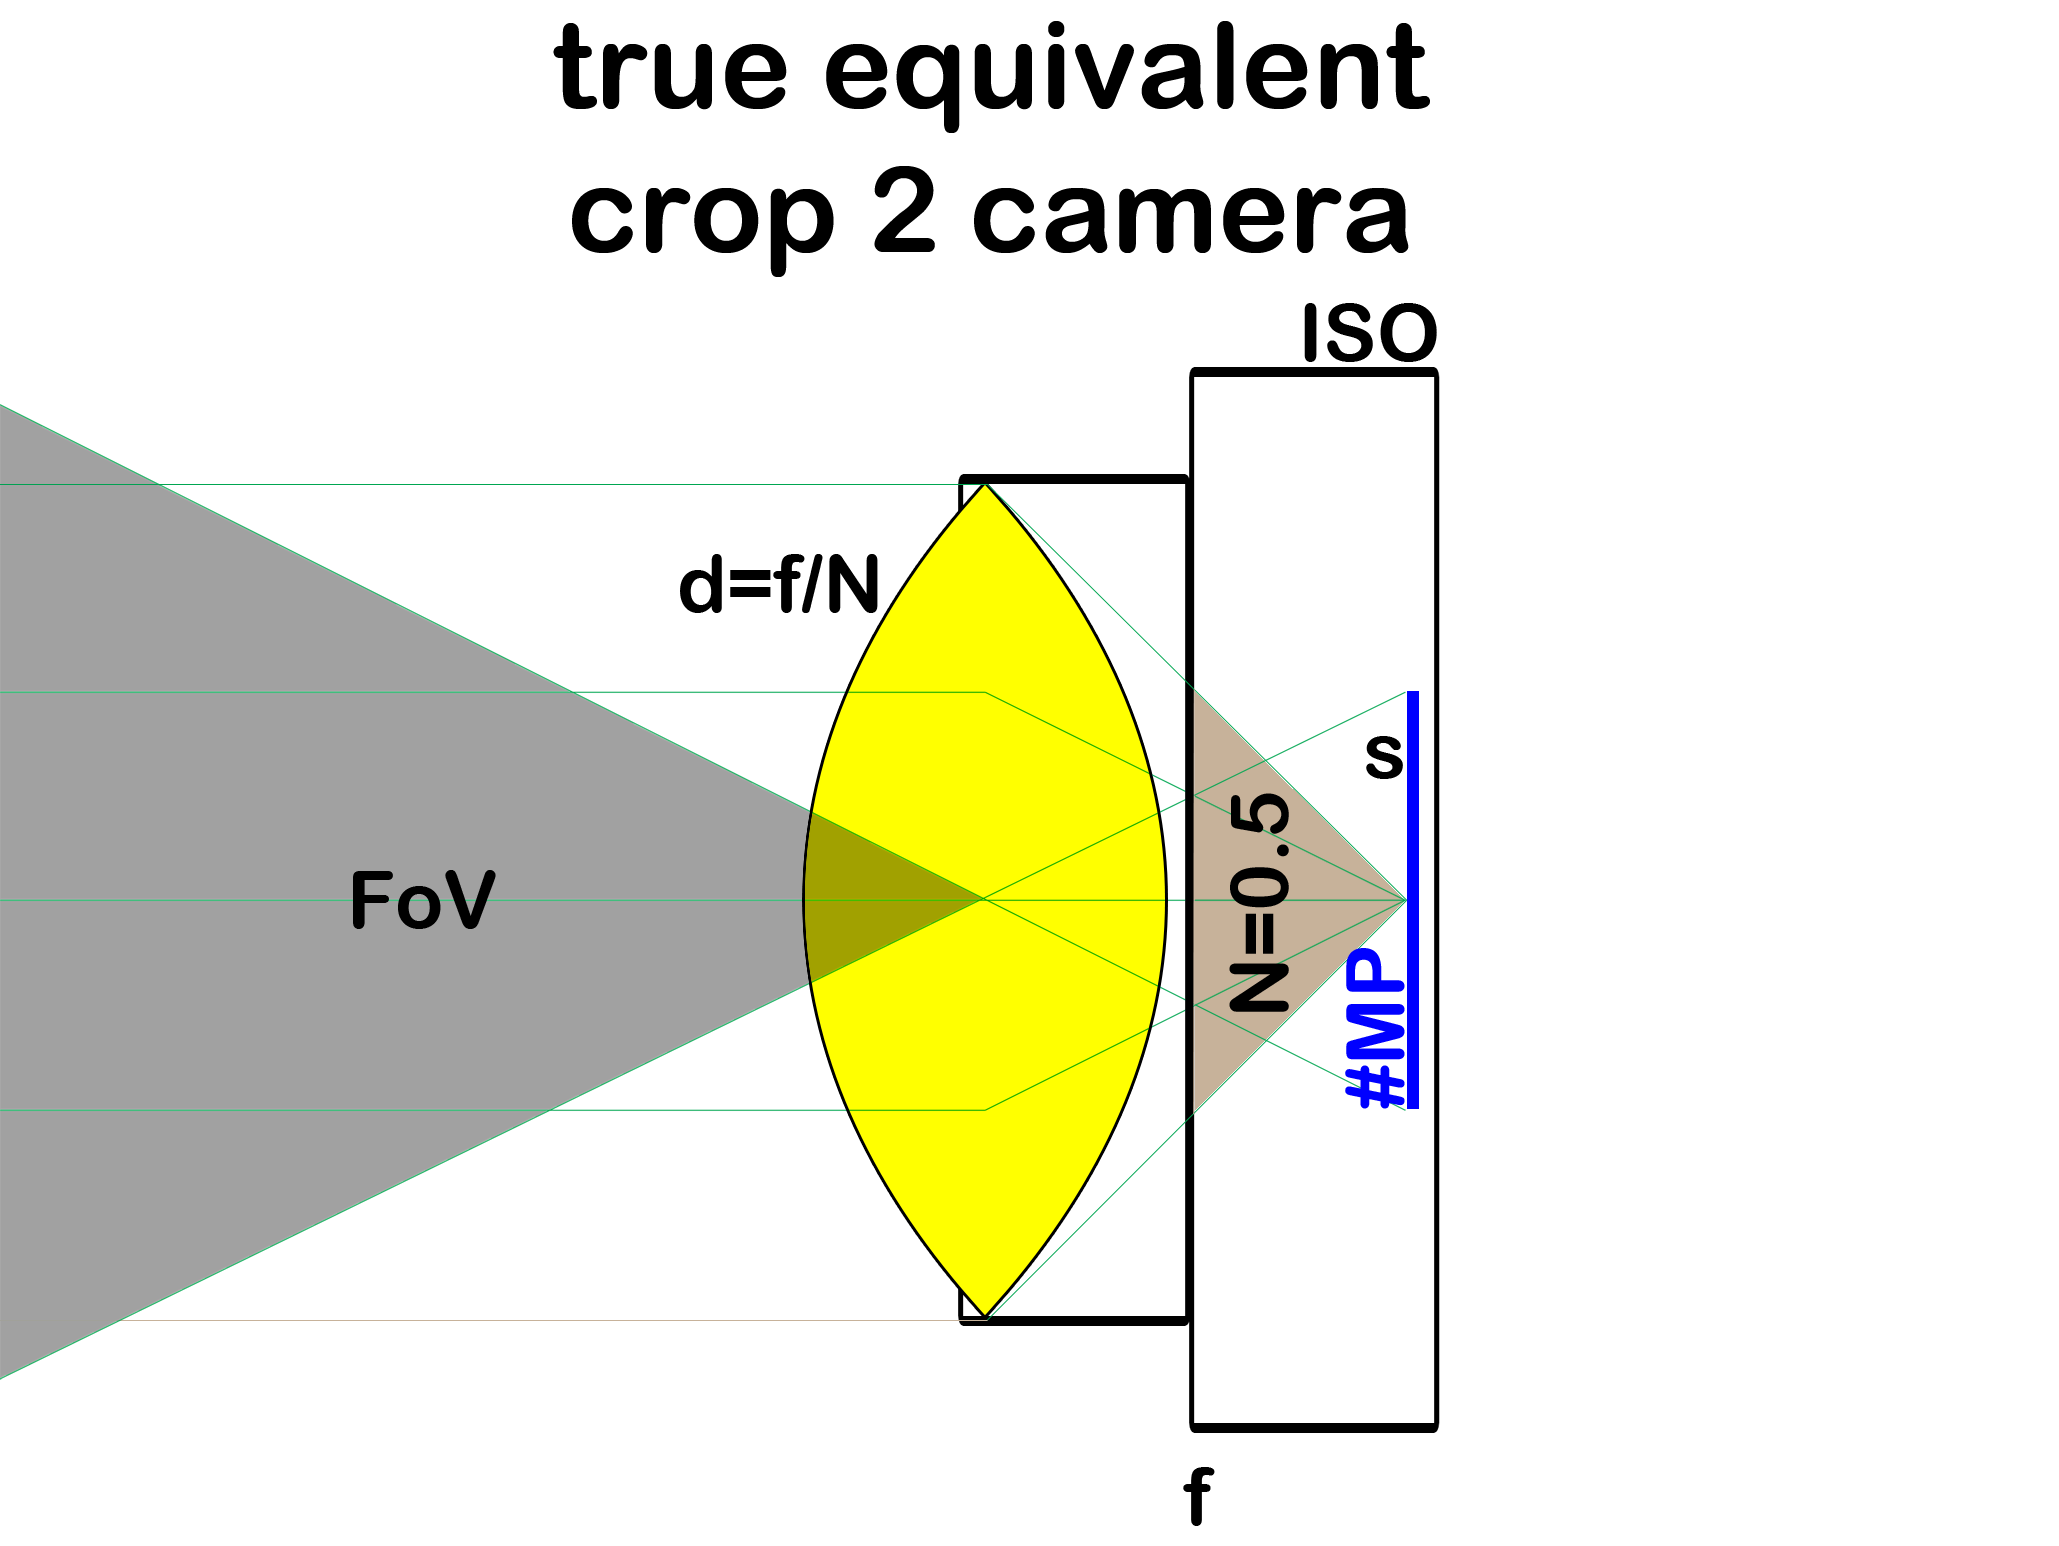
Various parameters, or variables of a real camera or a reference camera are depicted above
In preparation of an article discussing the advantages and disadvantages of various sensor sizes for a given camera performance, I try to set a common ground for such discussions.
I have prepared a white paper which dives much deeper into the topic than is possible in this short blog article. You may find it here:
The short version is this: An image contains no information whatsoever about the size of the sensor within the camera which was used to capture it. None. Nothing. Nada. (except EXIF of course ;) ) The proof is beyond the scope of this blog article and the article only gives some clues. But this is a fact, trust me.
Therefore, all cameras which could have captured a given image create a so-called equivalence class: they are all equivalent, producing indistinguishable images. And they have different sized sensors! By camera, I mean a camera with all the parameters defined it used to capture an image, such as the variables shown in the title image. Changing any variable "creates" a different camera. The exposure time used to capture an image is defined implicitely too: the one giving correct exposure (and it is a constant of course for indistinguishable images).
The following image shows an equivalent camera where the sensor has only half the size of the first or reference camera, i.e., an equivalent crop-2 camera:
Main claim:
Any discussion about the impact of varying sensor sizes must be based on cameras made equivalent first. Otherwise, any comparison will just reveal the inequivalence of parameters the respective cameras have been set to and nothing else. And such a result would be trivial, known and not worth a further discussion.
Such trivial results are that a larger sensor produces a more shallow depth of field or less image noise. This is not true! Because it just means that the cameras were used with non-equivalent settings, e.g., with lenses of different diameter d which means with lenses of different weight and cost. Another example are ISO comparisons between cameras with different sized sensors but ISO kept the same. Such comparisons are pointless! Instead, compare a FourThirds camera at ISO 100 with a full frame camera at ISO 400 because only then they are equivalent. Not doing so just compares the size of lenses which a ruler can do just as well.
Secondary claim:
Once equivalent cameras are compared, results start to become interesting. Because now any deviation is due to deviations with respect to an ideal camera. Such like a lens with aberrations, production or design tolerances or compromises in a CMOS production process. The white paper explains that such deviations are generally expected to be larger with smaller sized sensors. Of course, one such deviation is obvious: when an equivalent camera doesn't exist for a sensor size, e.g., because an f/0.1 aperture is unfeasible.
I will follow up this article with a more complete article of the impact of sensor size on image quality.
Stay tuned and enjoy your read :)
March 27, 2011
LumoLabs: Pentax K-5 low light focus with firmware upgrade 1.03

Fig.1: "Caribbean Sunset".
Why doing measurements is no substitute to taking photos (taken while I type) ;)
The current story is continued from the blog article Pentax K-5 low light focus after Pentax has published the version 1.03 firmware upgrade officially featuring an improvement of focus operation in low light.
When the 1.03 update was released, many users reported positive findings. So, I was optimistic to find that the low light focus issues are a thing of the past. Unfortunately, this isn't what I eventually found.
Please refer to the updated version of the complete paper for my findings:
- www.falklumo.com/lumolabs/articles/k5focus (HTML version)
- www.falklumo.com/lumolabs/articles/k5focus/K5Focus.pdf
(PDF version for download and offline reading)
Summary:
Basically, I find no significant difference between firmware versions 1.02 and 1.03 when using my testing scenarios. This means that there is no significant improvement if:
- The background is white
- The target has high contrast
- The AF assist light is disabled
Moreover, I found that at low enough light levels, the 1.03 firmware seems to rely more than 1.02 on color information outside the direct selected AF spot. With a uniform color distribution, this can lead to somewhat improved results in the vicinity of the focus shift transition. OTOH, the focus system is more easily fooled by features with a singular color. Overall, the advantages may dominate and the effect is small anyway. Version 1.03 still doesn't seem to make use of white balance information, either manually or automatic.
If I believe that Pentax improved the low light focus situation for many users of the 1.03 firmware, then the progress must be bound to any of the following:
- AF assist light engages more actively (not tested by myself).
- Focus improved in the presence of dark backgrounds (not tested by myself).
- Focus improved with low contrast or dim focus features (not tested by myself).
As much as I applaud Pentax to having addressed the problem, as much I am a bit disappointed they didn't dig deep enough to address the root problem: that the K-5 AF subsystem locks focus even in a situation where the colorimetric sensor(s) fails to determine the light color. It simply shouldn't lock focus at all then. Or ask for user assistance like a priming shot. The light-sensitive AF system of the K-5 has too strong a color dependency to autofocus if the color of the focus feature remains unknown.
A better workaround than 1.03 in firmware is feasible and should stay on Pentax' agenda.
Please, read the full paper linked above if you have further questions and come back here to leave comments or questions. General comments about the issue should still go to the general (earlier) article while firmware release 1.03 comments should go here. Thank You.
February 23, 2011
LumoLabs: Pentax K-5 low light focus
Note: I updated the article to version 1.3.
2011, March 27.
Note: I updated the article to version 1.1.
I think, the feedback and experiments done after version 1.0 helped to understand the observed focus behaviour rather well and version 1.1 takes this into account.
An important (new) aspect is a description how low key studio photography, esp. when combined with an f/4 lens (or slower), can lead to inaccurate focus.
2011, March 07.

Fig.1: Accuracy of the Pentax K-5 phase detect AF vs. luminosity in EV. The above chart includes all measurements, i.e. various lenses, light colors, distances and apertures. The accuracy is measured as deviation of the focal plane from the sensor plane, in µm.
In modern times, each new release of a digital SLR camera seems to be accompanied by teething troubles. This applies to all makes across the board. Sometimes, they are fixed quickly by the vendor, like the “Green Line Syndrome” video issue in the Pentax K-7, the “Hot Pixel” video issue in the Nikon D7000 or the “String of Pearls” stain issue in the K-5. Sometimes, they aren't like the shutter-induced blur issue with the K-7 which LumoLabs succeeded to document in this blog.
Currently, there are two remaining teething troubles for the K-5 which are widely reported: wrong PTTL exposure with external flashes in some situations (confirmed in writing by 3rd party flash makers, even for Pentax' own flashes). And a systematic wrong lock of autofocus in low (tungsten) light.
Therefore, LumoLabs has decided to have a closer look at the issue. After careful evaluation and many hundred test shots we found the issue to be real. Pentax has unofficially reported to work on the issue. The pressure is on them to address the issue and the author hopes that our findings may contribute to their efforts. Buyers of the K-5 must be able to be confident that the issue is fixed sooner than later.
A preliminary copy of the paper was provided to Pentax earlier this week and the head of Pentax Europe officially receives a printed copy today. I have been told that Pentax engineering will receive a copy too.
The study
The results are too complex to be presented in the scope of a blog. Fig.1 above provides a first idea of our work.
Please refer to the complete paper for our findings:
In a nutshell, this is what we find:
Move focal plane by 0xFF µm? Yes, do it so! :)
This may describe what's going on behind the curtain: a µm-valued variable becomes 0xFF (255) and causes a false shift of the focus plane by 255 µm. I call it the +0xFFµm hypothesis. :)
- Is it likely? No.
- Is it possible? Yes.
Please, read the full paper linked above if you have further questions and come back here to leave comments or questions. Thank You.
2011, March 27.
Note: I updated the article to version 1.1.
I think, the feedback and experiments done after version 1.0 helped to understand the observed focus behaviour rather well and version 1.1 takes this into account.
An important (new) aspect is a description how low key studio photography, esp. when combined with an f/4 lens (or slower), can lead to inaccurate focus.
2011, March 07.
Fig.1: Accuracy of the Pentax K-5 phase detect AF vs. luminosity in EV. The above chart includes all measurements, i.e. various lenses, light colors, distances and apertures. The accuracy is measured as deviation of the focal plane from the sensor plane, in µm.
In modern times, each new release of a digital SLR camera seems to be accompanied by teething troubles. This applies to all makes across the board. Sometimes, they are fixed quickly by the vendor, like the “Green Line Syndrome” video issue in the Pentax K-7, the “Hot Pixel” video issue in the Nikon D7000 or the “String of Pearls” stain issue in the K-5. Sometimes, they aren't like the shutter-induced blur issue with the K-7 which LumoLabs succeeded to document in this blog.
Currently, there are two remaining teething troubles for the K-5 which are widely reported: wrong PTTL exposure with external flashes in some situations (confirmed in writing by 3rd party flash makers, even for Pentax' own flashes). And a systematic wrong lock of autofocus in low (tungsten) light.
Therefore, LumoLabs has decided to have a closer look at the issue. After careful evaluation and many hundred test shots we found the issue to be real. Pentax has unofficially reported to work on the issue. The pressure is on them to address the issue and the author hopes that our findings may contribute to their efforts. Buyers of the K-5 must be able to be confident that the issue is fixed sooner than later.
A preliminary copy of the paper was provided to Pentax earlier this week and the head of Pentax Europe officially receives a printed copy today. I have been told that Pentax engineering will receive a copy too.
The study
The results are too complex to be presented in the scope of a blog. Fig.1 above provides a first idea of our work.
Please refer to the complete paper for our findings:
- www.falklumo.com/lumolabs/articles/k5focus (HTML version)
- www.falklumo.com/lumolabs/articles/k5focus/K5Focus.pdf
(PDF version for download and offline reading)
In a nutshell, this is what we find:
- The K-5 as it presently ships indeed has a flaw in its phase detect autofocus module or software which causes it to front focus in low light below a lens-dependent threshold in EV.
- If it does, it seems to consistently focus ≈ 255 µm behind the sensor plane (although with a significant ± 75 µm scatter of results which is about twice as large as the normal scatter of result).
- Faster lenses seem to keep working in lower light but of course, are prone to more blur when the front focus does eventually happen. Slower lenses can already start to front focus at light levels metering as 4 EV or 6 EV even. A fast lens may work down to 0 EV in white light.
- Light sources other than daylight emphasize this problem as they simply appear darker to the AF module. Moreover, it seems to be moderately color blind for red which further emphasizes the effect in deep tungsten light.
- The effect is real and can negatively impact the daily work of a photographer. On the other hand, it is possible to run into a low light tungsten situation without the problem.
- The paper clarifies conditions to hit or avoid the issue. White light (halogen is not white enough though) and a wide lens stopped down help to work around the problem. AF assist light typically doesn't help though. But an LED flash light does. ;)
Move focal plane by 0xFF µm? Yes, do it so! :)
This may describe what's going on behind the curtain: a µm-valued variable becomes 0xFF (255) and causes a false shift of the focus plane by 255 µm. I call it the +0xFFµm hypothesis. :)
- Is it likely? No.
- Is it possible? Yes.
Please, read the full paper linked above if you have further questions and come back here to leave comments or questions. Thank You.
December 1, 2010
LumoLabs: Pentax K-5 shutter

Total blur widths as a function of shutter speed for a Pentax K-7 camera (red) and a Pentax K-5 camera (green).
Our recent study of shutter-induced blur for the Pentax K-7 SLR camera has created a lot of buzz in the Pentax community. We are now actually watching to see similiar work been done for cameras of other vendors too.
Meanwhile of course I have been more than curious to see how the Pentax K-5 camera performs in this regard. I am glad to say that the lab work is done and a report is published. You may access it here (HTML and PDF):
In a nutshell: Pentax may not have changed much. But the little they changed helped. The increase of blur due to shutter operation (the amount which the image blur increases by at certain shutter speeds) is almost halved with respect to a K-7, at least at the most critical speed around 1/80s.
You may see this from the chart as depicted above as well. On average, the K-5 shutter induces a pixel blur increase by less than a pixel which should not be noticeable in day to day work. Normally, the increase is less due to other sources of softness or by not shooting at the shutter speed where the effect is largest.
Also note that every camera with a focal plane shutter (every SLR) will exhibit a certain amount of shutter blur for physical reasons.
We are not surprised to see the issue of shutter-induced blur for Pentax mitigated in the K-5. After all, the previous study for the K-7 was in reaction to numerous complaints and for the K-5, the first user feedback is very positive, incl. sharpness at the critical shutter speeds.
The conclusion cited from the white paper is this:
The shutter-induced blur in the Pentax K-5 is measurable but it should be small enough to be of no concern in day to day photography. The absolute magnitude of the effect sits halfway in between a K20D which has almost no measurable effect and a K-7 which exhibits an effect large enough to make some people notice in their work.
The matter may now have reached a satisfactory state with the K-5. But there remains work to be done for Pentax to fully understand and eliminate any unnecessary effects which compromise image sharpness.
It would be interesting to test another camera with fast shutter (like a D300s) to compare the absolute magnitude of the shutter blur effect which is never zero. Esp. at ~1/160 s. Ideally, vendors would measure it and make part of their cameras' shutter specification.
July 21, 2010
LumoLabs: Shutter-induced blur with an SLR camera

A recent observation made by us and others was that shake reduction efficiency for the Pentax K-7 camera seemed to have a weak spot around about 1/100s and less. Something nobody could really understand and not everybody was able to confirm.
Therefore, we decided to try to answer an old and fundamental question for SLR photography: To which extent does the mechanical focal plane shutter and the mirror slap negatively influence image sharpness? Especially in the digital age with its theoretically rather high image resolution. We, this means two friends (Henning and Rüdiger) and myself (Falk). And of course, we decided to focus our study to the Pentax K-7 SLR camera in order to provde an answer to the observation mentioned above.
The short story is that we managed to find the answers. All our findings are written down in detail in a LumoLabs White paper:
-> http://www.falklumo.com/lumolabs/articles/k7shutter/index.html.
Please refer to this document to actually understand the work we have done. In the following, we will summarize our findings without explaining how we got there. However, note that 4 different camera bodies, data from 4 testers, 8 lenses and two firmware versions have been used. More than thousand test shots and several thousand accurate blur data measurements have been aggregated. High speed video, acoustic recording and acceleration measurements complement the data. So, we assure that the result describe the general behaviour of a Pentax K-7 SLR camera. Pentax has obtained a copy of the paper to be used at their discretion.
We will make no statement about how the results relate to other SLR cameras. Except for a quantitative comparison with one Pentax K20D SLR camera.
Results:
- The mechanical focal plane shutter indirectly can increase the blur in an image. The exact amount of additional blur depends on the direction in the image. It is zero at a vertical contrast edge (aka yaw blur, blur due to yaw movement). And it is up to 11 µm (on average) at a horizontal contrast edge (aka nick blur, blur due to nick movement).
The exact amount of average blur is shown in the opening figure of this article. It has its maximum for shutter speeds of about 1/100s to 1/80s. It is less than 5 µm for 1/25s and slower. Or 1/250s and faster.
Note that any single image can be affected more or less. Add or subtract +/-50% to get an idea of variation from image to image.
Note that one pixel is 5 µm large and the blur effect is only visible if all other sources of blur are very well under control (sharpening, defocus, shake, subject blur, lens abberation, noise etc.). Normally, these other sources mask the effect. Nevertheless, if you want tack sharp images then you need to understand the shutter blur effect.
- The effect for the Pentax K-7 is larger than for the Pentax K20D. About 2 - 3x larger.
- Mirror slap or shake reduction have no negative or positive impact on the effect. Shake reduction works as advertized but cannot counteract the perturbation from the focal plane shutter as it is too fast really. Mirror slap is very well dampened in the K-7 camera and has no negative impact on image resolution except on a weak tripod.
There is a delay of about 10 ms between end of mirror slap and begin of shutter operation which suffices to keep the mirror slap perturbation out of the image.
- The blur effect is an indirect one:
First, the moving masses of the shutter (curtain etc.) make the body move (with surprising speed and acceleration of its stiff body!).
Second, the body movements cause a classical blur effect lasting as long as the shutter works. The K-7 shutter is faster and stronger than that of the K20D probably increasing the effect by some 60% or so.
Third, the body accelerations cause additional vibrations in the imaging sensor which last a bit longer than the first shutter curtain operates and which magnify the effect by another 60% or so.
Preventing the first from happening (which requires a heavy and sturdy tripod) will kill the effect. There is no "loose" magnetically held imaging sensor and no negative direct impact from shutter curtain or mirror slap causing air flow in the mirror box or whatever.
- In practice, you'll only see any effect with wide angle lenses.
At about 1/100s you would normally have blur due to free-hand shake (we can ignore the case of a tripod as only weak tripods would cause any trouble with the shutter). At 50 mm and longer, the shutter blur will be masked and at 30 mm it will have comparable magnitude. It is at 10-20 mm that the effect will be noticeable most.
In these cases, we highly recommend to shoot at 1/25s (or slower) and to enable shake reduction as it is highly efficient at such exposure speeds. The images will be sharper than at 1/100s!
- Early efficiency tests of the K-7 shake reduction suggested that it may be ineffective at fast shutter speeds as required for long focal lengths. This was a preliminary conclusion we proved to be wrong.
The Pentax shake reduction is effective even at 1/500s! It just cannot prevent the shutter blur at about 1/100s. We may soon publish an update to our SR guide reflecting this.
So, here you have it in a nutshell. Please, refer to the full paper before asking questions. The paper is available as HTML and PDF (linked from the top of the paper). It is recommended to download and read the White Paper on "Understanding Image Sharpness" first.
UPDATE (2010 July, 28):
We checked if the new firmware release 1.10.00.25 released earlier today brought an improvement. The answer is NO.
We've run a number of measurements and within the limits of our very good measurement accuracy (about 0.10 to 0.15 pixels error margins) we cannot see an improvement.
[end of update]
Frequently Asked Questions:
Q: Did you study the K-x, do you know if it has a similar effect?
A: No. But anybody is invited to replicate our study for the Penatx K-x :)
Q: Is the shutter blur in the Pentax K-7 a defect?
A: No, any SLR shutter for any make causes blur to some degree. We just wished for the Pentax K-7 that it would be as small as it is for the K20D. We publish this partly to remind all camera makers that we watch their work ;)
Q: Does switching off shake reduction lead to sharper images?
A: No.
Q: Does mirror lookup work around shutter blur?
A: No.
Q: Does a tripod work around shutter blur?
A: Sometimes. If it is rock solid. A normal tripod most likely won't help much.
Q: Why does a longer exposure time work around shutter blur?
A: Because during the majority of the exposure, the shutter won't move and what you get is an average blur.
Q: Why does a shorter exposure time work around shutter blur?
A: Partly, because there simply is less time for anything to blur. Partly, because stimulated vibrations cause no harm after the shutter already closed.
Q: May I ask questions without reading the White paper?
A: No.
Q: But I don't understand the White paper!
A: How do you know without reading it? ;)
Q: Will you win a Nobel price for this crazy shit of work?
A: No. Alfred Nobel forgot photographers ;)
Further reading:
- Understanding Image Sharpness White Paper
- Understanding Image Sharpness White Paper PDF
- Shutter-induced blur with an SLR camera White Paper (this work)
- Shutter-induced blur with an SLR camera White Paper (this work) PDF
- Why the lens has little effect: Theory of pitch and shift of a camera+lens combination in reaction to moving shutter mass (PDF)
Enjoy the read ;)
June 17, 2010
LumoLabs: Understanding Image Sharpness
We have prepared our first White Paper. It shall serve as a base to better understand our methodologies to measure image resolution and more importantly, it is meant to help understand what factors can prevent an image from turning out tac-sharp.
LumoLabs website
We changed the layout of our site too.
LumoLabs is now at www.falklumo.com/lumolabs and hosts a repository of articles.
Therefore, we will use the blog to announce new articles or important updates to followers and interested parties. And to enable their discussion.
The actual articles are not posted as a blog article as its format was deemed unsuitable. But you'll find links to both the online article and a printable PDF version. If possible, we always recommend to download and read the PDF version. The PDF version does update more frequently too ;)
Understanding Image Sharpness
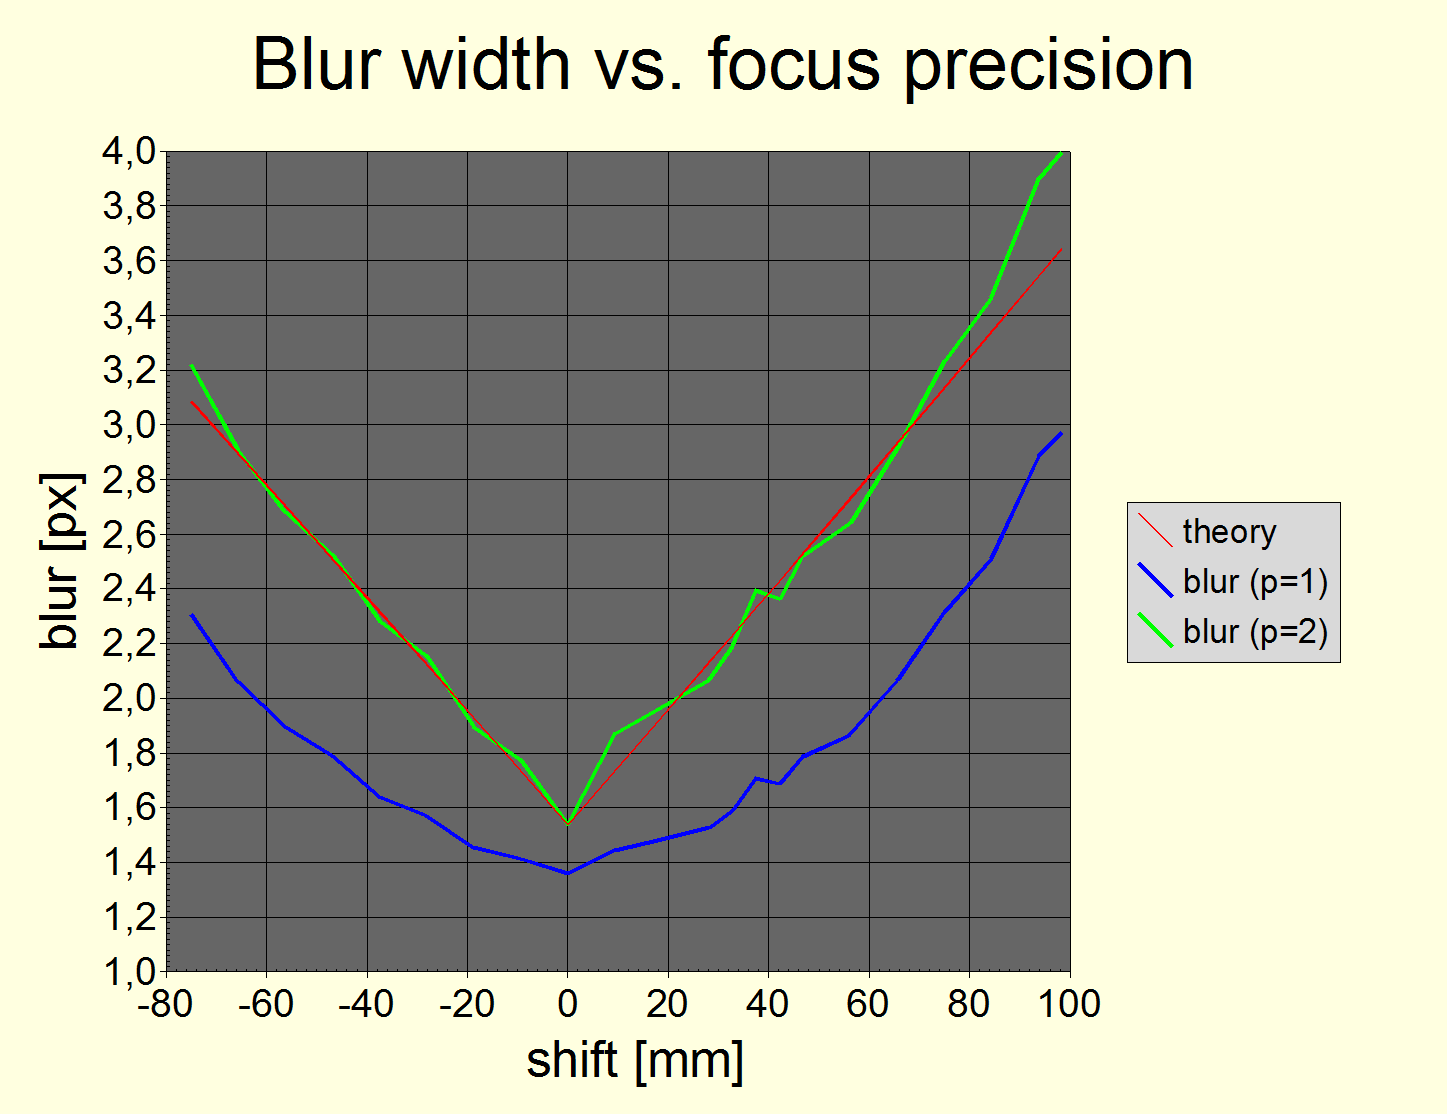
(Sample chart form the article)
Hint: The article image URLs actually open as larger images as they appear embedded in the article.
This article is a recommended read for anybody loving to dig into technology and who isn't afraid of a bit of math.
It's abstract and table of contents is:
Abstract
This White Paper is one in a series of articles discussing various aspects in obtaining sharp photographs such as obtaining sharp focus, avoiding shake and motion blur, possible lens resolution etc. This paper tries to provide a common basis for a quantitative discussion of these aspects.
Table of Content
1. Measures
1.1. Modular Transfer Function
1.2. Blur
1.2.1. The hard pixel
1.2.2. The perfect pixel
1.2.3. The real pixel, sharp and soft
1.3. More realistic resolution measures
1.4. Combining blur
2. Sources of blur
2.1. Defocus
2.1.1. Ability of deconvolution operators to reduce defocus blur
2.2. Bayer matrix and anti aliasing
2.3. Diffraction
2.4. Lens aberrations
2.4.1. Defocus, Spherical aberration, Coma, Astigmatism
2.5. Shake
2.5.1. Measuring shake
2.5.2. Expected shake
2.5.3. Empirical results
2.5.4. Tripod classification
2.6. Motion blur
2.7. Noise
2.8. Atmospheric perturbations
2.9. Precision and calibration
3. Practical considerations and examples
Please, proceed here:
LumoLabs website
We changed the layout of our site too.
LumoLabs is now at www.falklumo.com/lumolabs and hosts a repository of articles.
Therefore, we will use the blog to announce new articles or important updates to followers and interested parties. And to enable their discussion.
The actual articles are not posted as a blog article as its format was deemed unsuitable. But you'll find links to both the online article and a printable PDF version. If possible, we always recommend to download and read the PDF version. The PDF version does update more frequently too ;)
Understanding Image Sharpness
(Sample chart form the article)
Hint: The article image URLs actually open as larger images as they appear embedded in the article.
This article is a recommended read for anybody loving to dig into technology and who isn't afraid of a bit of math.
It's abstract and table of contents is:
Abstract
This White Paper is one in a series of articles discussing various aspects in obtaining sharp photographs such as obtaining sharp focus, avoiding shake and motion blur, possible lens resolution etc. This paper tries to provide a common basis for a quantitative discussion of these aspects.
Table of Content
1. Measures
1.1. Modular Transfer Function
1.2. Blur
1.2.1. The hard pixel
1.2.2. The perfect pixel
1.2.3. The real pixel, sharp and soft
1.3. More realistic resolution measures
1.4. Combining blur
2. Sources of blur
2.1. Defocus
2.1.1. Ability of deconvolution operators to reduce defocus blur
2.2. Bayer matrix and anti aliasing
2.3. Diffraction
2.4. Lens aberrations
2.4.1. Defocus, Spherical aberration, Coma, Astigmatism
2.5. Shake
2.5.1. Measuring shake
2.5.2. Expected shake
2.5.3. Empirical results
2.5.4. Tripod classification
2.6. Motion blur
2.7. Noise
2.8. Atmospheric perturbations
2.9. Precision and calibration
3. Practical considerations and examples
Please, proceed here:
- Online article (same as click onto blog title)
- PDF print version
October 28, 2009
Lumolabs: Pentax K-x vs. K-7, sensor and video

Pentax has recently released a new SLR, the Pentax K-x. And while it is positioned at the entry-level market and very competitively priced, it is yet rumoured to have a very good noise performance.
After having done all my lab tests, I may say that the rumors are not true.
The truth is that the K-x may be the 35mm SLR camera which has the best high ISO noise and dynamic range performance to date. This isn't "very good". This is outstanding!
This is my concluding summary which is based on the following individual articles:
- Lumolabs: Pentax K-7 HD video quality
- Lumolabs: Pentax K-x HD video quality
- Lumolabs: Pentax K-7 sensor quality
- Lumolabs: Pentax K-x sensor quality
Noise and Dynamic Range comparison:
At the top of the article is a compilation of various gray sample patches for both cameras, for direct comparison. The patches are from linear raw files (cf. "further reading" at the end of the article).
The resulting 18% gray level chart is like this:

Signal to noise ratio of 18% gray luminosity and color temperature 2900°K (halogen tungsten). Using manufacturer ISO stops 100, 200, 400, 800, 1600, 3200, 6400, 12800. The interpretation of results is the same as for the corresponding graphs on dxomark.com. E.g., print-normalization is for 8 megapixels. The dotted lines indicate the slope for pure photon shot noise.
Obviously, the K-x has no true ISO 100 and both cameras reduce noise even in RAW at ISO 3200 and higher. The ISO sensitivity of the K-x seems to be slightly higher, like at ISO 100, true ISO were more like 87 for the K-7 (DxO's value for the K20D) and 105 for the K-x. However, the above curves have not been left/right-shifted to take this into account.
Gray level noise at ISO 1600/3200 for the K-x is about the same as at ISO 1000 for the K-7. While gray level noise at ISO 1600 and 3200 are about the same for the K-x, there is a minimal loss of resolution when looking at the pattern part in the full test charts. Nothing serious, though.

Signal to noise ratio (SNR) for the Pentax K-7 and K-x. Full measurement for various luminosities and ISO settings at color temperature 2900°K. Measurement similiar to dxomark.com. The dotted lines indicate the slope for pure photon shot noise. The flattening at 30% gray and brighter is believed to be due to systematic measurement errors like imperfect gray patches. The dashed curves for the K-x have been properly normalized to match the higher sensor resolution of the K-7.
The curve for K-7 only and test images are at:
Full SNR Pentax K-7
The curve for K-x only and test images are at:
Full SNR Pentax K-x
The K-x/ISO 200 and K-7/ISO 100 curves are almost identical down to 1% luminosity.
The full SNR graph clearly exhibits the true strength of the K-x sensor: it maintains the good SNR at low luminosity levels. This is an indication that the read-out noise from this sensor is very low.
Therefore, the K-x sensor outperforms the K-7 in low light situations whereas the K-7 outperforms the K-x in good light. This is further confirmed by the better resolution and more artifact-free images from the K-7.
Video:
The quality from HD video is very good. The resolution is as high as the 720p mode allows. It somewhat more moiré and color moiré artifacts than the K-7 and therefore, may not exactly match its analog and film-like quality in 720p mode. But it is very good nevertheless.
Conclusion:
The Pentax K-x has a sensor which rivals the best. That Pentax makes it available in the entry-level class is a good thing. On the other hand, the Pentax K-7 excells in many respects and even its noise performance isn't bad. It is in line with the rest of the competition which is beaten by the K-x in this respect now.
Pentax K-x: "Editor's choice" (entry level, available light)
Pentax K-7: "Editor's choice" (semi professional)
Further reading: Lumolabs testing methodology.
Lumolabs: Pentax K-x sensor quality

The Pentax K-x is an incredible machine for an entry level SLR. Here, I will look at the image quality which its sensor can produce.
In my lumolab testings, I will not report about ergonomics or lack of features etc. The internet is full of this easily obtained information and I will refrain from duplicating it here.
Test chart results:
The photo at the top of the article is an ISO test shot taken at ISO 1600 and color temperature 2900°K. It is a linearly converted RAW file (cf. "further reading" at the end of the article). Go to the gallery (click the image) to have a look at all test shots, available at original full size.

ISO resolution test chart using FA 31 Ltd. at f/4.5. The inner part is 4x. The Nyquist limit is at "7.1" in the inner part. Watch the original at 100% size.
The K-x resolves down to the Nyquist limit. However, it exhibits color moiré and false demosaicing at the limit frequency. The anti alias filter is very weak or absent as it allows for moiré down to three times the Nyquist limit. Color moiré is visible for textures at the Nyquist frequency.
E.g., note that the "7" patch has false demosaicing and strong color moiré. The same is visible from the zone plate chart. The K-7 doesn't show this in comparison.

Zone plate test chart using FA 31 Ltd. at f/4.5. The big circles have a resolution limit of 1280 LW/PH. The smaller ones are 2x and 4x. The 4x circles at above ~4000 LW/PH have uncolored printing moiré. The Nyquist limit is at 2848 LW/PH which is about 55% into the smallest circle. Watch the original at 100% size.
The zone plate chart of the K-x has false colors (fringing) already at half the Nyquist frequency and "green blobs" at three-quarter of the Nyquist frequency, followed by heavy color moiré at the Nyquist frequency exactly. The latter two effects are limited in spatial frequency space but the fringing is kind of disappointing.
While most testers will not notice the effect and welcome "the good resolving power of the K-x", which "leaves no resolution advantage to the K-7" (anticipated quotes from future pseudo tests), I personally would have preferred a stronger anti alias filter.
Numerical lab result:
The numerical evaluation of all noise charts (the full SNR plot) is as follows:

Signal to noise ratio (SNR) for the Pentax K-x. Full measurement for various luminosities and ISO settings at color temperature 2900°K. Measurement similiar to dxomark.com. The dotted lines indicate the slope for pure photon shot noise.
It is possible to derive both dynamic range and noise from the graph. If extrapolating the 0db point for ISO 100 at luminosity 0.01%, then the resulting dynamic range is 13.3 EV (print-normalized to 13.6 EV). E.g., DxO tests the print-normalized dynamic range of the K20D to be 11.05 EV and of the outstanding Nikon D3X to be 13.65. The flattening at 30% gray and brighter is believed to be due to systematic measurement errors like imperfect gray patches.
The theoretical photon noise separation between neighboring ISO lines is 3dB. There are three effects which can be observed:
- The SNR at ISO 100 is reduced for luminance levels above ~3% and drops to the ISO 200 values. A sign that ISO 100 is no native IO value for this sensor. On the other hand, it is exceptionally high for luminance levels below ~3%, with a boost more like ISO 75 than ISO 100.
- The ISO 3200 line is only 0.5 dB separated from the ISO 1600 line. DxO labs found that this is due to noise reduction applied to RAW data at ISO 3200 and higher. Without such noise reduction, the SNR would obviously be about 2.5 dB lower. This smoothing is even stronger than for the K-7.
Overall, the gray level noise (the SNR at luminosity 18.00%) is very close to the competition (worse at ISO 100, same at ISO 200 and better beyond) while the black level noise (the SNR at luminosity 0.10%) is very small. The ISO 1600 curve provides about the same black signal than ISO 100 pushed +4EV.
I have not measured SNR for luminance below 0.04%. But from extrapolation one may deduce that the K-x has a dynamic range of about 13.6 EV which would be even an excellent value for a full frame camera.
Update - The K-x "bump" at 2%, ISO 100 (2009, October 29):
Because of the importance of the ISO 100 SNR curve at low luminosities for the outstanding dynamic range claim made for the K-x, I have evaluated available testing material again, with special emphasis on this bump.

Signal to noise ratio (SNR) for the Pentax K-x. Full measurement for various luminosities and ISO 100 at color temperature 2900°K. Measurement similiar to dxomark.com. The dotted lines indicate the slope for pure photon shot noise.
This graph is meant to study the "bump" at about luminosity 2% in the ISO 100 curve of the full SNR graph (cf. above). The full 12 EV test chart is compiled from two parts: one exposed normally, another underexposed by 5 stops.
The above plot is a reexamination of both parts, now separately evaluated. There indeed is a discontinuous step (by +1.8 dB) when going from the normal to the -5EV curve which I cannot currently explain. The flattening of the brightest parts looks the same and could indeed be due to imperfect bright print patches. This would imply an underestimation of the "bump" by another 1.7 dB leading to a possible overall overestimation of SNR by +3.5 dB in the dark part.
Even taking this correction into account though, the above plot still confirms an extrapolated 0 dB SNR point at 0.01% luminosity. Therefore, the conclusions made in the other sesctions are not altered by this detail examination.
(end of update)
Conclusion:
- Resolution: Full Nyquist 12.2 Mpixel resolution, some moiré, some color moiré, some demosaicing artifacts. Very weak or absent anti alias filter.
- Noise: Gray level 40.0 dB at ISO 100, 31.6 dB at ISO 1600, dynamic range (print-normalized) >13 EV.
The image quality is good at low ISO values and very good if shadows are pushed-processed. It is outstanding at high ISO values and sets the bar for 2010. I haven't tested the Nikon D700 but from the known results, I say that the Pentax K-x is seriously challenging the D700 in terms of high ISO noise and dynamic range. With a much smaller body, a smaller sensor and a much smaller price tag ... and video ;)
I award the Pentax K-x the following title:
"Dynamic range champion 2009 in the 35 mm body class".
Further reading:
- Lumolabs: Pentax K-7 sensor quality
- Lumolabs testing methodology.
Lumolabs: Pentax K-7 sensor quality

I have previously reported about the image quality from the Pentax K-7.
The corresponding blog articles are here:
- Tungsten high iso noise
- Comparative noise study K-7 vs. K20D
- Comparative resolution study K-7 vs. K20D
Here, I will set a level playing ground for future comparisons of the image quality obtained from various cameras.
In my lumolab testings, I will not report about ergonomics or lack of features etc. The internet is full of this easily obtained information and I will refrain from duplicating it here.
Test chart results:
The photo at the top of the article is an ISO test shot taken at ISO 1600 and color temperature 2900°K. It is a linearly converted RAW file (cf. "further reading" at the end of the article). Go to the gallery (click the image) to have a look at all test shots, available at original full size.

ISO resolution test chart using FA 31 Ltd. at f/4.5. The inner part is 4x. The Nyquist limit is at "7.8" in the inner part. Watch the original at 100% size.
The K-7 resolves down to the Nyquist limit with very little color moiré and false demosaicing. The anti alias filter is rather weak as it allows for moiré down to twice the Nyquist limit. Color moiré is under control though.

Zone plate test chart using FA 31 Ltd. at f/4.5. The big circles have a resolution limit of 1280 LW/PH. The smaller ones are 2x and 4x. The 4x circles at above ~4000 LW/PH have uncolored printing moiré. The Nyquist limit is at 3104 LW/PH which is about 61% into the smallest circle. Watch the original at 100% size.
The transition at the Nyquist limit is rather smooth (the printing moiré being stronger than the sensor moiré) with almost no color moiré.
Numerical lab result:
The numerical evaluation of all noise charts (the full SNR plot) is as follows:

Signal to noise ratio (SNR) for the Pentax K-7. Full measurement for various luminosities and ISO settings at color temperature 2900°K. Measurement similiar to dxomark.com. The dotted lines indicate the slope for pure photon shot noise.
It is possible to derive both dynamic range and noise from the graph. If extrapolating the 0db point for ISO 100 at luminosity 0.07%, then the resulting dynamic range is 10.5 EV (print-normalized to 10.9 EV). E.g., DxO tests the print-normalized dynamic range of the K20D to be 11.05 EV which is about the same. The flattening at 30% gray and brighter is believed to be due to systematic measurement errors like imperfect gray patches.
The theoretical photon noise separation between neighboring ISO lines is 3dB. There are two effects which can be observed:
- The SNR drops faster than required by photon shot noise at gray levels under about 1%. This reduces the dynamic range. Gordon B Good found that this is due to a rather large read-out noise caused by the variable gain amplifiers (VGA) integrated into the CMOS sensor chip.
- The ISO 3200 line is only 1 dB separated from the ISO 1600 line. DxO labs found that this is due to noise redauction applied to RAW data at ISO 3200 and higher. Without such noise reduction, the SNR would obviously be about 2 dB lower.
Overall, the gray level noise (the SNR at luminosity 18.00%) is very close to the competition while the black level noise (the SNR at luminosity 0.10%) is rather large. This is of concern if brightness needs to be pushed in post processing. Interestingly, the ISO 1600 curve provides a better black signal than ISO 100 pushed +4EV.
Conclusion:
- Resolution: Full Nyquist 14.6 Mpixel resolution, weak moiré, very weak color moiré, nearly no demosaicing artifacts.
- Noise: Gray level 40.5 dB at ISO 100, 28.1 dB at ISO 1600, dynamic range (print-normalized) 10.9 EV.
The image quality is excellent at low ISO values and if shadows aren't pushed-processed, good at low ISO values otherwise and in line with the 2008 competition at high ISO values.
Further reading: Lumolabs testing methodology.
Lumolabs: Pentax K-7 HD video quality

I have previously reported about the HD video mode in the Pentax K-7.
The corresponding blog articles are here:
Here, I will set a level playing ground for future comparisons of the video image quality obtained from various cameras.
In my lumolab testings, I will not report about ergonomics or lack of features etc. The internet is full of this easily obtained information and I will refrain from duplicating it here.
The above is a frame from a dumb sample video, available here:
Bavarian Camels (K-7 version).
Test chart results:

Video frame from 720p HD mode. ISO resolution test chart using FA 31 Ltd. at f/4.5. The inner part is 4x. The 720p Nyquist limit is at "8.5" in the outer part. The 1024p Nyquist limit is at "10.0" in the outer part. The color moiré shows that the 720p frames are downsampled from 1024p video frames.
Watch the original at 100% size!

Video frame from 1536x1024p HD mode. The 1024p Nyquist limit is at "10.0" in the outer part and "2.5" in the inner part. The resolved parts with distinct lines is about "8.0" in horizontal and "8.5" in vertical direction, corresponding to 1200x850 pixels in 3:2 or about 1200x717p pixels in 16:9 mode.

Video frame from 720p HD mode. The big circles have a resolution limit of 1080 LW/PH. The smaller ones are 2x and 4x. The Nyquist limit is at 720 LW/PH which is about 67% into the big circle. The Nyquist limit of the 1024p sampling is at 864 LW/PH which is 80% into the big circle. Watch the original at 100% size.
The sampling frequency is clearly visible by the position of the four false color disks positioned at an 80% radius. The false color at and remaining artefacts beyond the sampling frequency is due to a missing video anti alias filter.
A similiar image for the Canon 5DmkII is visible here: Canon 5DmkII zone plate test.
Rolling Shutter Test:
Panning left and right to evaluate the rolling shutter effect.
Note that the sensor of the Pentax K-7 is read out in the opposite direction compared to that of the Pentax K-x, like top-down rather than bottom-up.
Conclusion:
The Pentax K-7 delivers stunning HD video quality, specifically in 720p. It has color moiré artifacts close to the Nyquist frequency which are due to subsampling without an anti alias filter. The artifacts are strong but seem to be nicely confined to a close neighborhood around the sampling frequency. So, in real footage one has to really hit the "wrong" texture to see the effect.
The effect seems to be about that of a Canon 5DmkII along horizontal lines. But the Canon has no such artifacts along vertical lines, pointing to supersampling within lines and line skipping. The Pentax K-7 does line and row skipping. Obviously, the 5DmkII scans 1053 lines whereas the K-7 only scans 1024 lines.
Moreover, in 1024p along nearly vertical edges (cf. the 1024p resolution test chart), one can see the magenta/green fringing and a double seam effect. This is much less visible in 720p though. Additionally, it may be possible to cure it in post processing. The subjective effective resolution in 16:9 is about 1200x717 or 0.9 MPixel. This is a good value actually not achieved by consumer HD camcorders.
Due to its supersampling applied to 720p video, footage from the K-7 looks more cinema-like and analog than footage from entry-level dSLRs.
Further reading: Lumolabs testing methodology.
Lumolabs: Welcome and testing methodology

Welcome to Lumolabs.
I never was really satisfied with the big lab tests (dxomark.com and dpreview.com) and really was disappointed by print magazine and other ezine tests. So, I decided to set up my own testing laboratory, based on experience as a photographer, insight as a physicist, software writing and image processing skills and patience.
For the time being, I am not challenging the big labs and confine my ambitions to the following areas:
1. RAW file image quality, in particular noise, dynamic range and resolution.
2. Video frame image quality, in particular resolution and artifacts.
3. Pentax.
I am not looking into color accuracy (not even chrominance noise...) or the camera's JPG engine. Or autofocus, ergonomy, build quality, etc. I may do lens tests and other vendors later as well.
Let me provide you with a short summary of my testing methodology:
RAW file treatment
I use the RAW file from the camera (DNG preferred) and use Adobe Lightroom 2.4 (LR) to do the demosaicing. The standard settings must be altered in the follwing ways to get a neutral demosaiced 16Bit sRGB TIFF file:
- Gray card calibrated white balance (I use 2900°K halogen tungsten light).
- Blacks 0 (changed from 5)
- Brightness 0 (changed from 50)
- Contrast 0 (changed from 25)
- Sharpening 0 (changed from 25)
- Noise reduction Color 0 (changed from 25)
I then read the resulting 16Bit sRGB TIFF file into my own lumolabs software. I properly convert the sRGB response curve (which isn't exactly a gamma curve) into linear colors and 18% gray is RGB 117.6/255.
Taking test chart photos
I then take test chart photos with controlled manual settings, including manual focus. About the slowest shutter speed is 1/15s.
Some think that noise test shots must be taken in low tungsten light. I agree for the tungsten part and I use it. I disagree for the low light part, though. A short exposure is a perfect approximation to low light because the read-out time of the sensor is longer than 0.1 seconds anyway whatever fast be the shutter. So, only if I wanted to study exposure time longer than, say 1/5s would low light be able to have an influence. In consequence, I don't publish exposure times shorter than 1/10s. Additionally, except for initial focus, I avoid using live view in noise tests to not overheat the sensor.
One of my test charts is the zone plate chart useful to evaluate anti alias filter and Bayer mosaic filter artifacts. It is shown in the beginning of the article. It is allowed to download it for own testing purposes, providing proper credit is given.
Other testing charts are an ISO-12233 resolution chart which I modified to include inner parts of 4x the resolution. Another chart is the noise testing chart with defined gray and color patches. All charts are printed on A2 paper using a high end photo printer. There are minimal printing artifacts visible at and beyond 4000 LW/PH (line widths per picture height). They do not disturb the testing results though.
The density range of the printed noise test chart is about 7 EV. So, I take a second shot at -5EV and obtain a combined test chart of about 12 EV dynamic range (luminance range 0.02% to 100%). Which immediateley turned out to be outperformed by the recent Pentax K-x ;)
My software will search for patches of minimal variance to exclude the effect of scratches and the like which may be present on the printed test chart. I am not sure though that there aren't some invisible defects below the -40dB range. They do not disturb the testing results though, except maybe for very bright patches.
SNR, noise and dynamic range
I am unrelated to DxO Labs, Boulogne, France. However, whereever I found their methodology to be appropriate (cf. dxomark.com), I adopted it. I disagree on some of their methodologies but some are best practise to be followed. My biggest concern with DxO is their lack of examination of influence of spatial frequency dependencies. They only "correct" their results for resolution effects as to be expected from pure photon shot noise. IMHO, this isn't good enough. I am currently working at a new testing methodology to overcome this. For the time being though, I am happy to adopt DxO's pixel-level measure methodologies.
It is therefore important to understand the SNR [dB] figure. It is explained here: SNR.
Another important detail is the print normalization: Noise, dynamic range etc. are all improved by downsizing an image. Still, measures take place at the varying resolution of the sensor. Like DxO, I use a "print-normalization" calibrated to a 8 MPixel resolution. The normalization formulae are here: print-normalization.
SNR [dB] can be easily understood by using the follwing hints:
- A patch of basically random pixels has an SNR of 0 dB.
- A decrease of light by 1 EV, doubling the ISO, going to a 50% darger region in an image or doubling the number of pixels all amount to a change of SNR by -3dB.
- Going from 1.53 crop APS-C to full frame amounts to a change of SNR by +3.7dB. So, 3dB is a lot ...
My full SNR curves can be directly compared with the DxO mark tab "Full SNR". Note however that DxO uses noise patches made from glass, has a different light source most importantly at a different color temperature and uses a different raw converter. Also, in derived measures, I don't include ISO sensitivity variance and possible raw data noise reduction (smoothing).
The dynamic range is the luminance level where SNR reaches 0dB, converted to f-stops and normalized for resolution. Note that the 0dB level is arbitrarily choosen by DxO and is resolution dependent. They formula-correct for resolution dependency but fail to understand that the full dynamic range must be measured at a much lower resolution. I plan to address this issue.
Video frame tests
The video frames studied in the video section are extracted using the Quicktime Pro "export as an image" feature. Because the video uses the camera's JPG engine, here are the parameters:
- Pentax: WB manual (2900°K), "Natural color profile preset", all other parameters at default values (like noise reduction and sharpness -1).
Enjoy the tests :)
Subscribe to:
Posts (Atom)